What it is
The Dashboard is the first entry of the menu. It answers two questions about your WhatsApp number: how many conversations are starting, and what is open right now. Once your onboarding checklist is done, it is also where you land when you sign in.
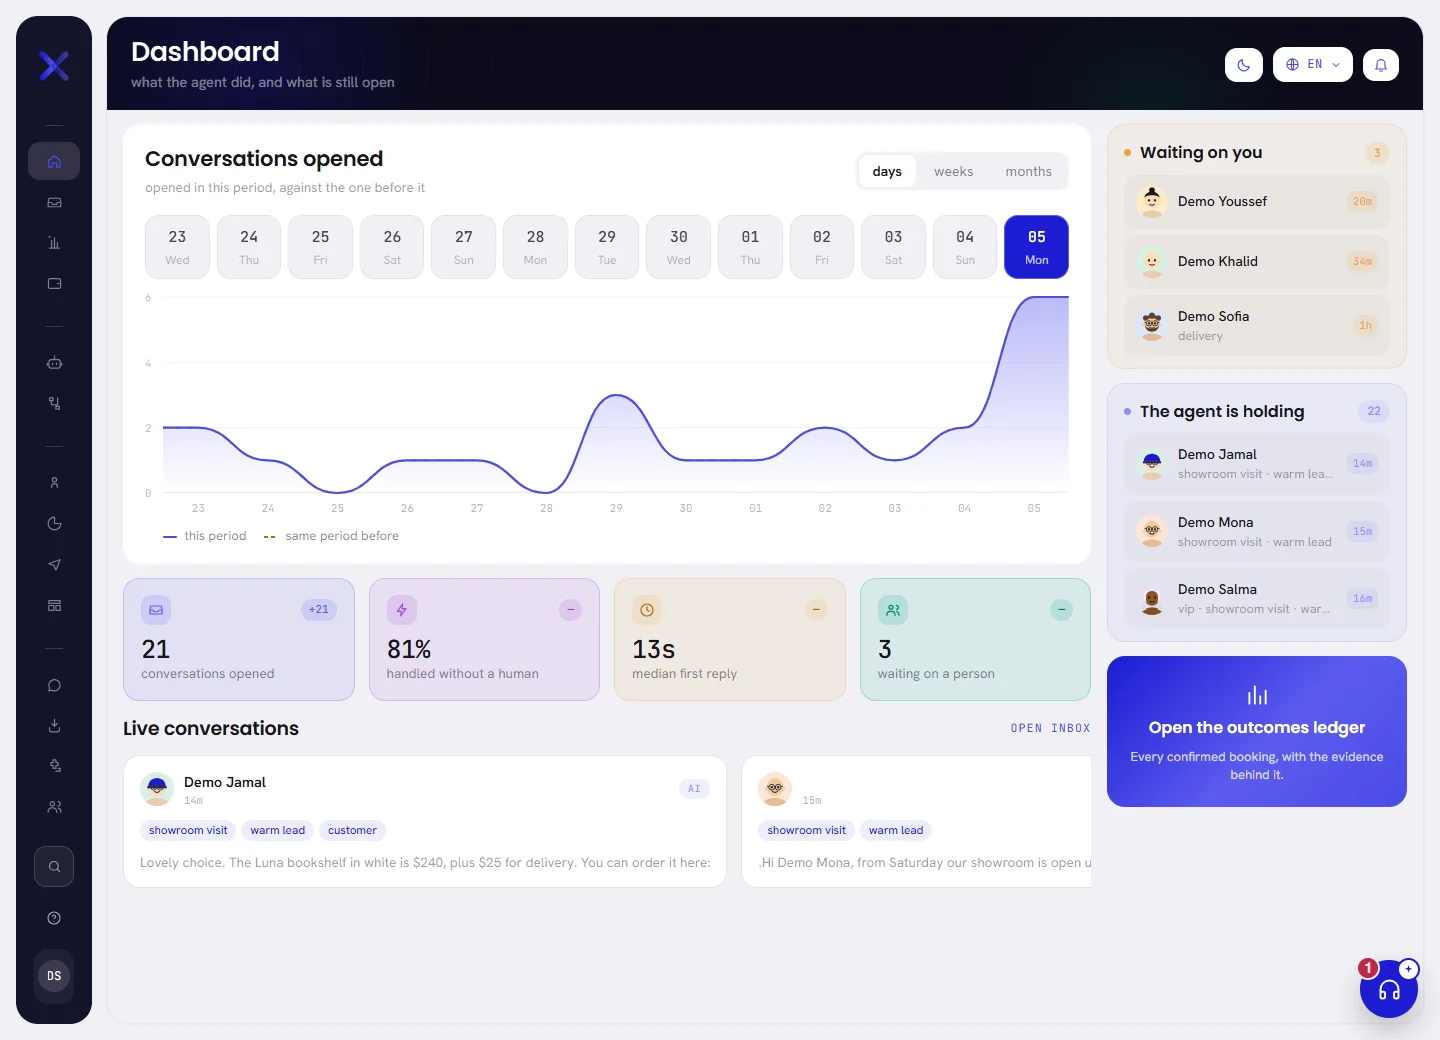
Every figure is for the whole workspace, and is the same for everybody who opens the screen. The figures are worked out when the page opens: reload it to bring them up to date.
Conversations opened
The chart counts the conversations that started in each day, week or month. A conversation counts once, on the day it started, however long it goes on.
Choose Days, Weeks or Months at the top of the card.
The chart then covers the last 13 days, the last 10 weeks or the last 12 months, ending with today, this week or this month.
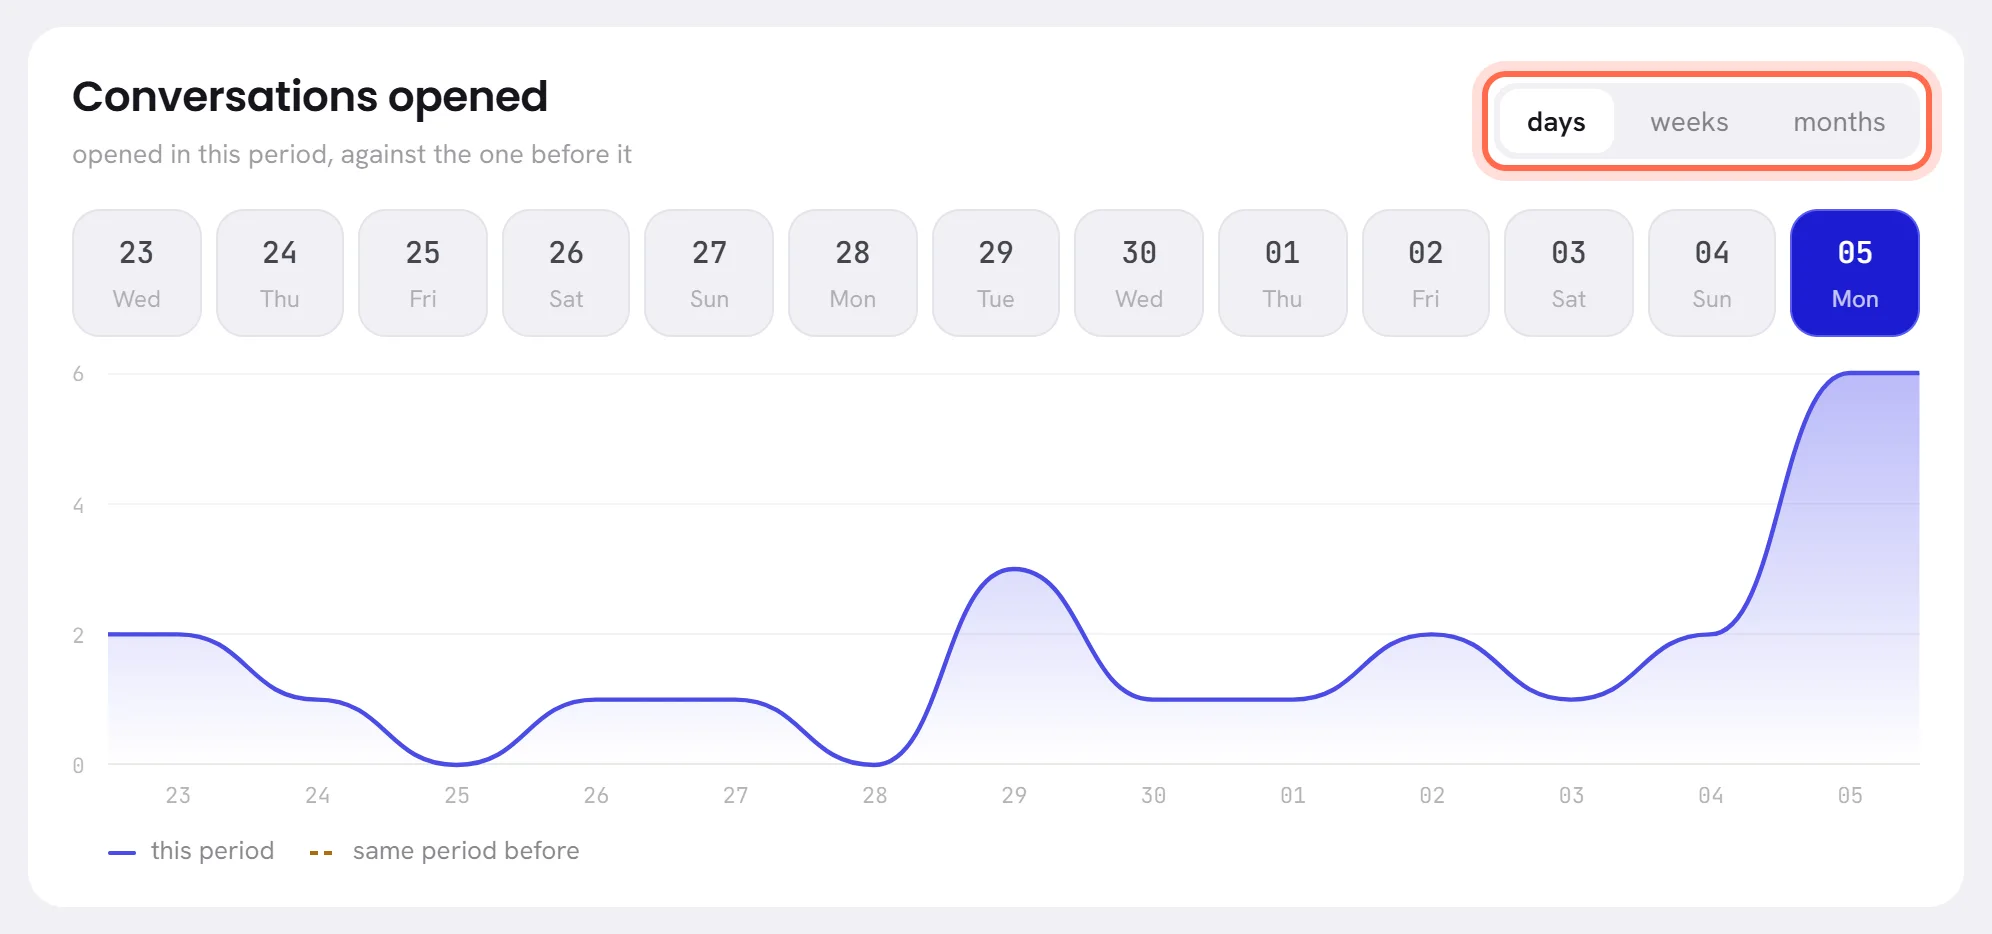
Read the row of boxes for what each point of the chart is.
There is one box for each day, week or month, in the same order as the chart, and the newest is highlighted. A day shows its date and weekday, a week its number and month, a month its name and year.
Point at the chart to read a figure.
A label shows the count for that day, week or month, for example
5 chats · 05. On a phone, tap the chart instead.
| On the screen | What it does |
|---|---|
| Days | The last 13 days, one point a day. |
| Weeks | The last 10 weeks, one point a week. |
| Months | The last 12 months, one point a month. |
| This period | The solid line: conversations opened in each day, week or month. |
| Same period before | The dashed line: the same count for the stretch of the same length that came just before, so you can see whether you are busier than you were. |
Days begin at midnight in your workspace’s time zone, and weeks on the day set as Week starts on. Both are in Workspace settings.
The four tiles

| On the screen | What it does |
|---|---|
| Conversations opened | How many conversations started in the whole stretch the chart covers: 13 days, 10 weeks or 12 months. The small figure at the top of the tile is the change against the stretch before, for example +21. |
| Handled without a human | Of those conversations, the share that is not assigned to a person. It shows a dash when no conversation started in that stretch. |
| Median first reply | How long a customer’s message waited for the next reply in its conversation, from your agent or from a person. It is the middle value over the last 30 days, whatever the chart is set to, written in seconds, minutes, hours or days: 13s, 4m, 2h. |
| Waiting on a person | Conversations that are open now, that your agent is not handling, and that nobody has taken. This one is counted at this moment, not over a period. |
A dash in a tile means there is nothing to measure yet. Only the first tile compares itself with the stretch before; the other three show a dash at their top corner.
Live conversations
Under the tiles are up to three conversations that are open now: those nobody has taken come first, then the ones with the most recent message. Each card shows the contact’s name, how long ago the last message was, up to three of the contact’s tags, the last message, and a badge saying who holds the conversation.
| On the screen | What it does |
|---|---|
| Waiting | Nobody holds it: it is waiting for a person. |
| On a team | It is in a team’s queue and no member has taken it yet. |
| AI | Your AI agent is handling it. |
| A colleague | Somebody in your workspace has taken it. |
| Open inbox | Opens the Inbox. Pressing a card does the same. |
When no conversation is open, the screen says Nothing is waiting on a human right now.
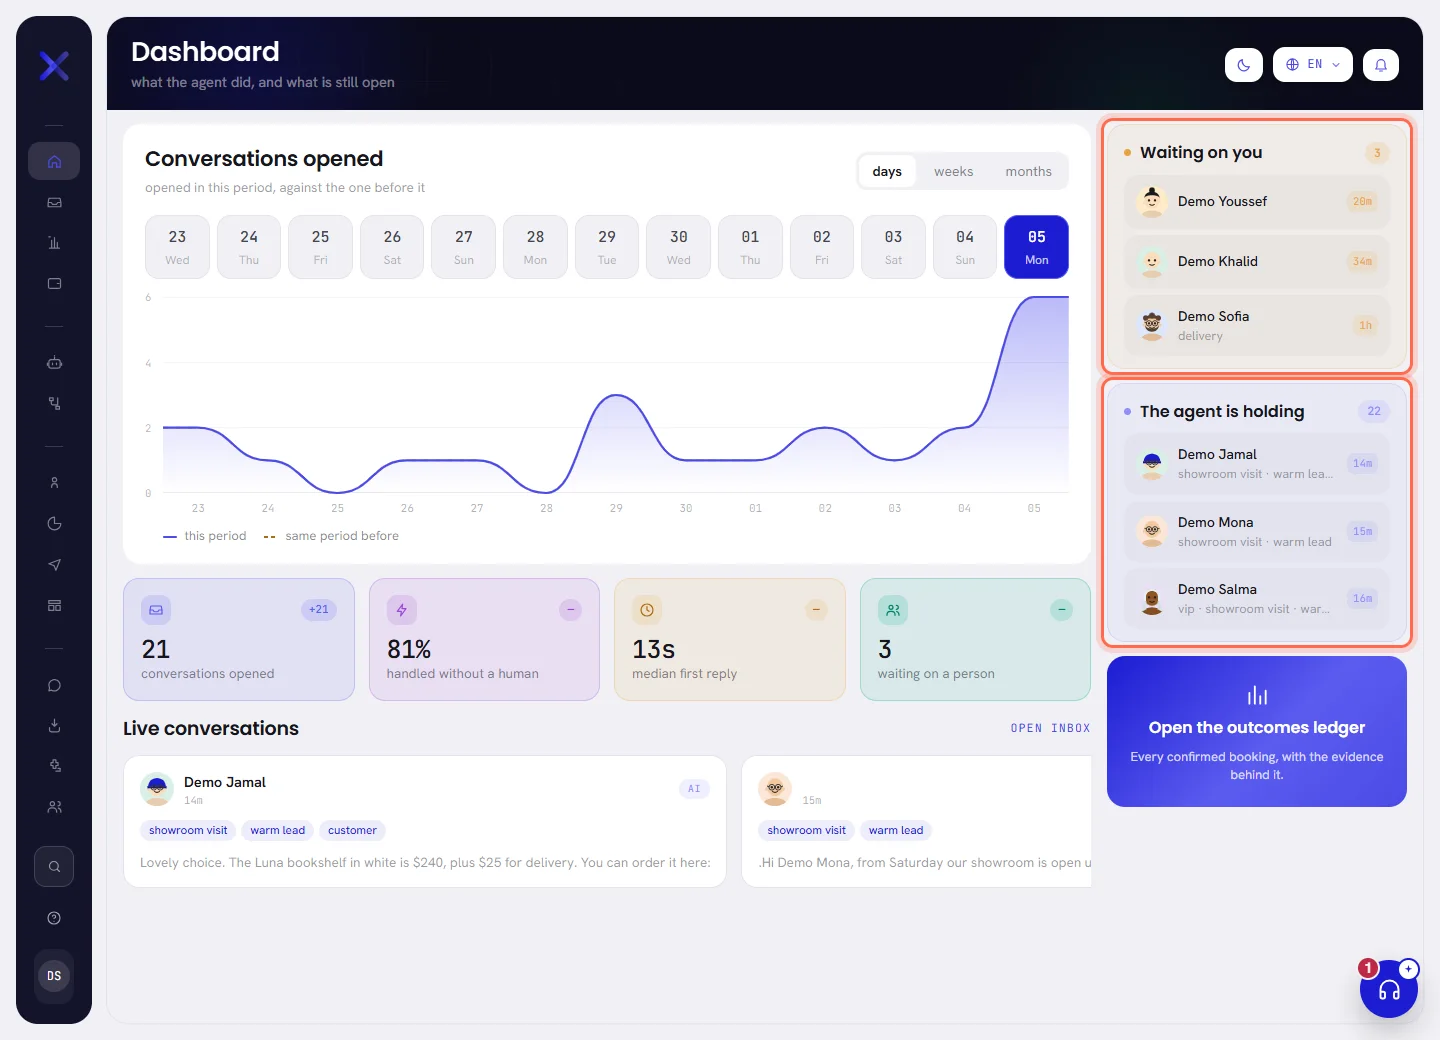
The two lists at the side
| On the screen | What it does |
|---|---|
| Waiting on you | Conversations that are open, that your agent is not handling, and that nobody has taken. The figure beside the title is how many there are, the same as the tile Waiting on a person, and the three most recent are listed. The dot beside the title blinks while there is at least one. |
| The agent is holding | Open conversations your AI agent is handling: how many, and the three most recent. |
Each line shows the contact’s name, tags and the time since the last message, and opens the Inbox. “You” means your workspace here: the first list is everybody’s to pick up, not only yours. Assign and hand over explains how a conversation gets taken.
Under the two lists, the card Open the ledger leads to the ledger: every charge and every payment of your workspace. Only the people who may open the ledger see the card.
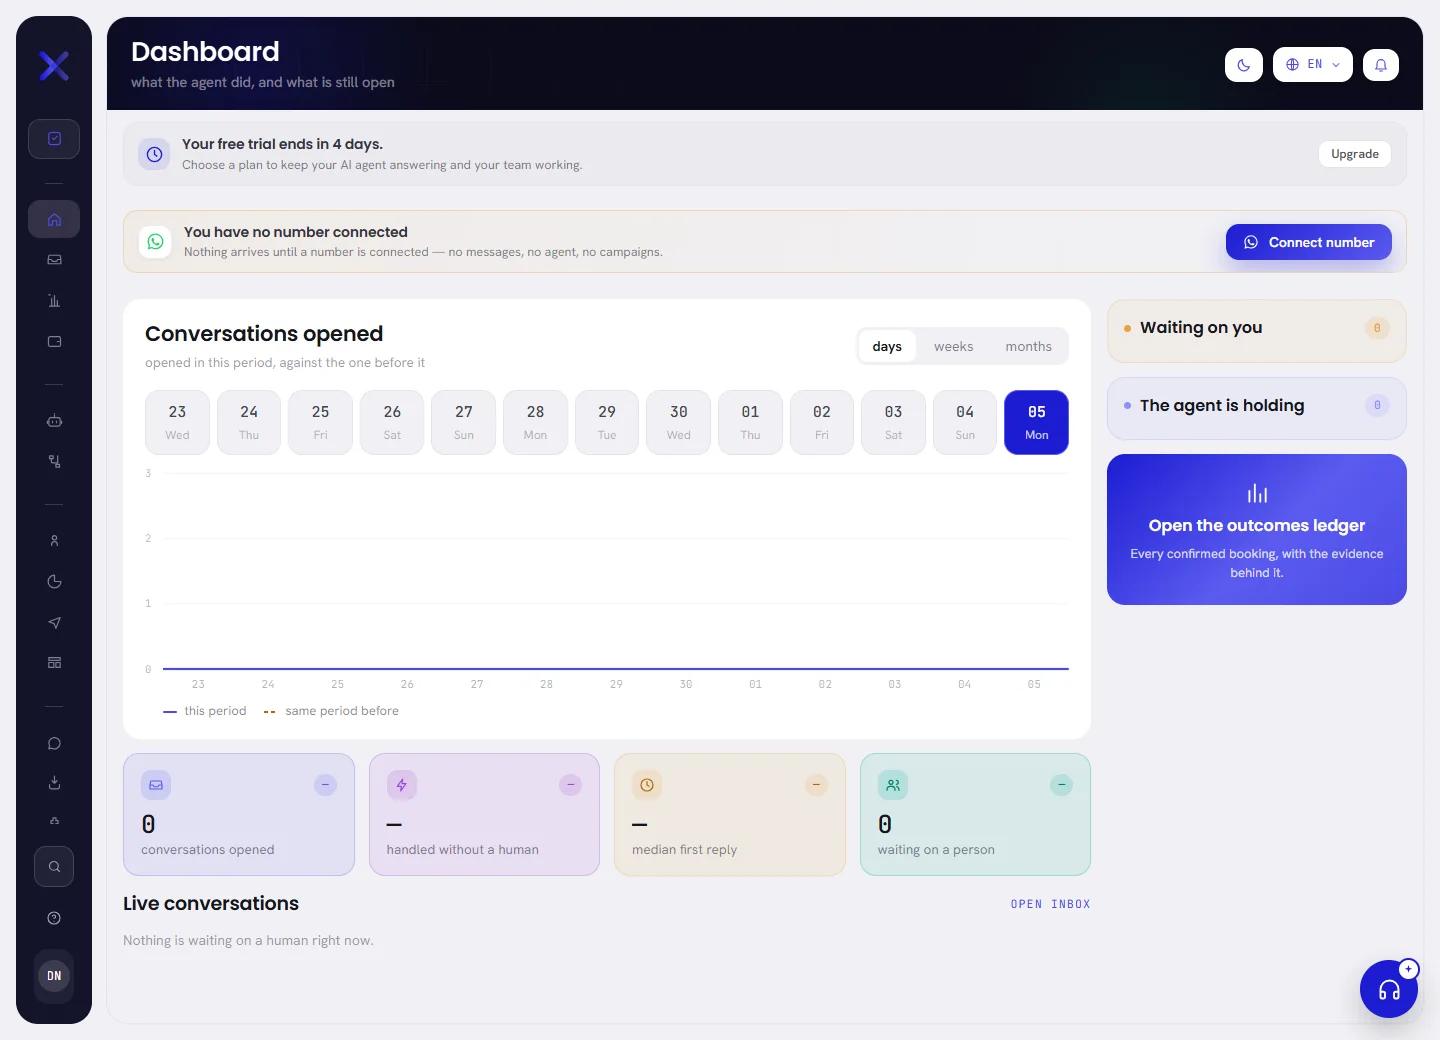
In a new workspace
Before a number is connected there is nothing to count: the chart is a flat line at zero, the tiles show 0 or a dash, and both lists are empty. The figures start to move with the first customer who writes to your number.
Good to know
- Everybody in a workspace can open the dashboard, whatever their role.
- The dashboard is a summary. For figures you choose the period of, with delivery, replies and consent, open Reports.
- The bell at the top keeps itself up to date while the dashboard is open; the dashboard’s own figures change when you reload.